

Windows memory compression reduces the size of less-active pages so Windows can keep more data in physical RAM before paging to disk. A non-zero compressed value is normal on Windows 10 and Windows 11. Check Task Manager and Get-MMAgent first; leave compression enabled unless a repeatable test shows a specific problem, because disabling it can increase paging and disk activity on a memory-limited PC.
What Windows memory compression is
Windows memory compression is a feature of the Memory Manager introduced for modern Windows versions. When a page has not been used recently but is still worth keeping close, Windows can compress its contents in RAM instead of immediately writing the page to the page file. Compression reduces the space needed for that page. If an application asks for it again, Windows decompresses it and returns the data to the working set.
This is a tradeoff between CPU work, RAM capacity and storage latency. Compression consumes some processor time, but reading a compact page from RAM is generally faster than waiting for a disk-backed page to be read. The operating system decides which pages are candidates and adapts to current pressure. It is not a permanent archive and it is not the same as deleting data from memory.
The most visible clue is Task Manager. On the Performance > Memory page, the In use line can show a value in parentheses labelled compressed. That value is the amount of physical memory occupied by compressed data, not an extra pool that should be added blindly to every other number. It can rise during ordinary multitasking, then fall when applications close or the system needs the space.
A useful first conclusion is therefore modest: compressed memory proves that Windows is using a memory-saving technique. It does not by itself prove a leak, a damaged installation or a performance problem. Record the value together with available memory, committed memory, disk activity and the workload that produced the symptom.
- Normal: a compressed value appears while many tabs, games or creative applications are open, while the system remains responsive.
- Worth investigating: compression, low available memory and heavy paging appear together with the same reproducible stutter or delay.
- Not a diagnosis: a large number on its own, especially after a long uptime, does not tell you which process or driver is responsible.
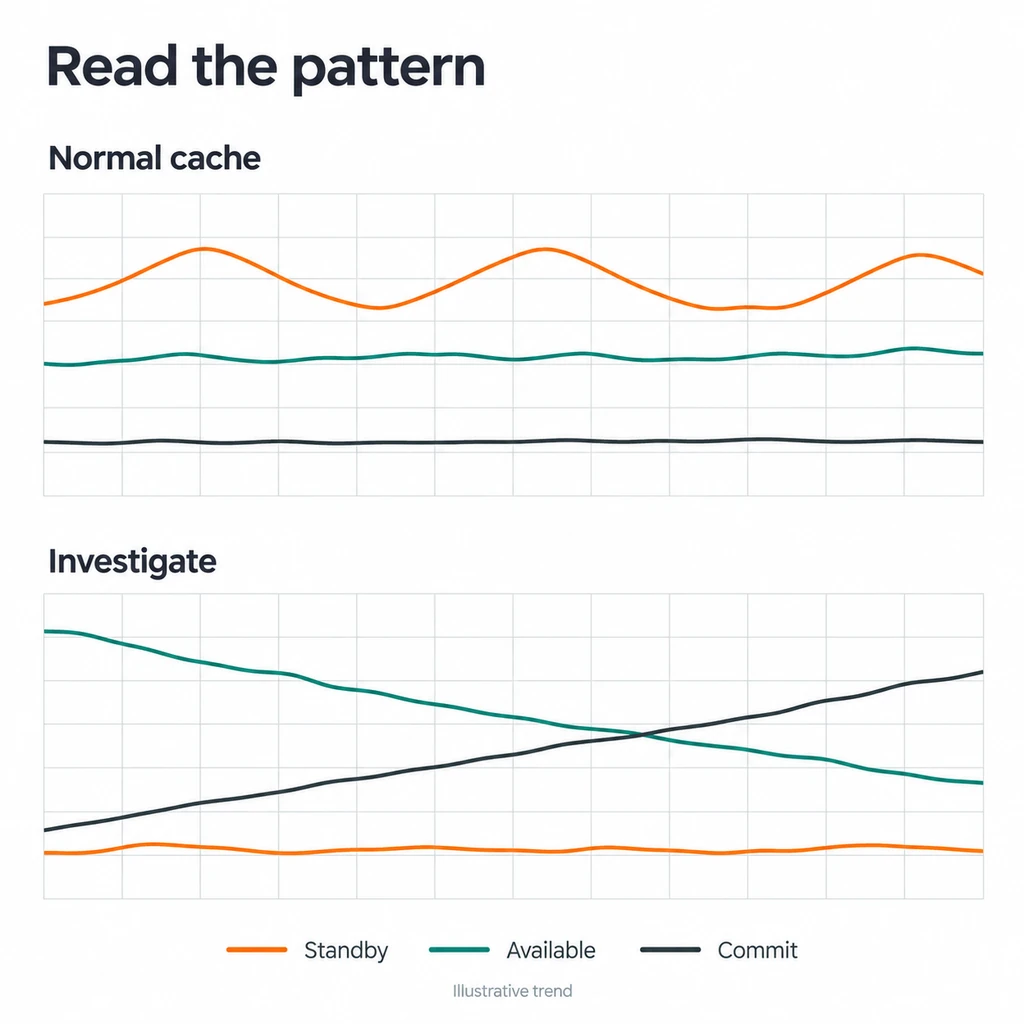
Windows chooses when to compress pages. Do not treat the compressed figure as a cleanliness score or as proof that RAM must be purged.
Compression, standby memory, and the page file
Three Windows terms are often mixed together: compressed memory, standby memory and the page file. They are related because they all help the Memory Manager balance speed and capacity, but they describe different states. Compressed memory is data represented in a smaller form inside physical RAM. Standby memory is cached data that can be reused or discarded when another application needs the space. The page file is storage that can hold memory-backed data when Windows decides RAM pressure requires it.
That distinction matters for this site because the existing Windows standby memory guide answers a different question: how to interpret available, free and standby values. The Windows 11 cache guide covers a controlled standby-list test. Neither page recommends disabling Memory Manager compression. Use the correct page for the state you actually observed.
A simple comparison can keep the investigation honest. If standby memory is high while available memory is healthy, clearing it may only remove useful cache. If compressed memory is visible while the system is responsive, that may be normal efficiency. If commit is near its limit and disk activity is high, the pressure may be paging or a workload that needs more RAM. Changing the compression switch cannot solve every one of those conditions.
| State | Where it lives | What it means | First check |
|---|---|---|---|
| Compressed memory | Physical RAM | Less-active pages stored in a smaller form | Task Manager compressed value and Get-MMAgent |
| Standby memory | Physical RAM cache | Reusable cached pages that can be reclaimed | Available memory and the standby lists in RAMMap |
| Paged memory | Page file or other storage | Data moved or backed by storage under pressure | Committed memory, disk activity and page-file health |
| Active working set | Physical RAM | Pages currently needed by running processes | Processes tab and the workload that shows the symptom |
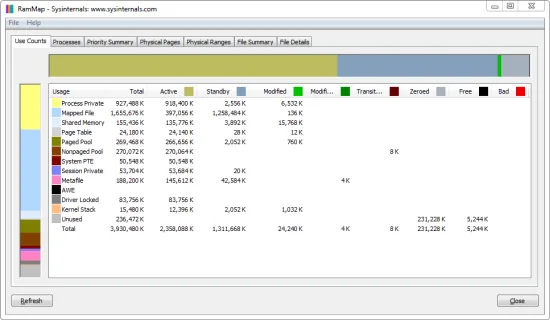
Do not schedule a standby purge merely because Task Manager shows compressed memory. Identify the state and reproduce the symptom first.
How to check Windows memory compression
Start with a read-only check. Open Task Manager with Ctrl+Shift+Esc, choose Performance, select Memory and note In use, Available, Committed and the compressed value in parentheses. Keep the same workload open for a few minutes and write down whether the number changes when the symptom occurs. This gives you a baseline without changing Windows settings.
PowerShell provides a second view. Open Windows Terminal or PowerShell as an administrator and run Get-MMAgent. The output includes the MemoryCompression setting. On a supported Windows installation, MemoryCompression : True means the feature is enabled. A missing or unexpected result is a reason to check the Windows build and command spelling, not a reason to paste a random registry tweak.
You can also inspect the System process in Task Manager, but do not interpret its memory number as the compressed store alone. The System process includes kernel and driver allocations. Use it as a clue alongside the Performance > Memory view, Resource Monitor, event logs and a repeatable workload. If a driver leak is suspected, update or isolate the driver rather than turning off a general memory feature.
Capture a small record before you change anything: Windows edition and build, installed RAM, page-file setting, lowest available memory, peak committed memory, compressed value, disk activity and the exact action that caused the delay. A short log makes it possible to undo a change and compare like with like.
- Run the status check before launching a cleaner, a scheduled task or a benchmark overlay.
- Use an elevated PowerShell window for enable and disable commands; a normal window is enough for viewing if policy permits.
- Save the original `Get-MMAgent` output so you can verify the rollback later.
- 1
Open the memory view
Press Ctrl+Shift+Esc, choose Performance, select Memory and record Available, In use, Committed and the compressed value.
- 2
Check the feature state
In an elevated PowerShell window run `Get-MMAgent`. Read the MemoryCompression line and keep the output with your baseline notes.
- 3
Reproduce one symptom
Repeat the same game area, application action or file workflow while watching available memory, commit and disk activity. Stop if the system becomes unstable.
The status command is evidence, not an optimization. Do not infer a cause from the compressed value without a matching symptom.
How to enable or disable it safely
Windows normally enables memory compression and manages it automatically. If you have a documented compatibility test or a reproducible CPU-related problem, you can make a reversible change from an elevated PowerShell session. First record the current state, close work that could be interrupted and create a restore point or confirm that you can undo the command.
To disable the feature, run Disable-MMAgent -mc. To enable it again, run Enable-MMAgent -mc. These commands change the Memory Manager agent setting; they do not clear the standby list, repair a page file or tune ISLC. Windows may require a restart before the new behavior is fully reflected. After restarting, run Get-MMAgent again and repeat the same workload.
Do not combine this test with a new ISLC threshold, a timer-resolution change, a RAMMap purge or a driver update. If several changes happen together, you cannot tell which one affected the result. Keep the test short, record CPU time, disk activity, available memory and application responsiveness, then restore the original setting if the evidence is weak or the system becomes less stable.
Disabling compression can look helpful on a system with plenty of RAM and a very specific CPU bottleneck, but it can also make a constrained system page earlier. On an 8 GB laptop, the same change may increase disk writes and application reloads. Treat the command as a diagnostic experiment, not a universal Windows 11 performance setting.
- Disable: `Disable-MMAgent -mc` in an elevated PowerShell window, followed by a restart if Windows requests one.
- Enable: `Enable-MMAgent -mc` to restore the normal managed behavior, then verify with `Get-MMAgent`.
- Rollback rule: if paging, stutter, application reloads or disk use worsen, re-enable compression and keep the before/after notes.
PowerShell commands affect system behavior. Confirm the target command, use an administrator session and keep a rollback path before changing the setting.
Should you disable memory compression?
For most Windows 10 and Windows 11 PCs, leave memory compression enabled. It is a built-in way to keep more data in RAM and reduce storage trips when memory pressure rises. A compressed value that comes and goes during normal work is evidence that the feature is doing something, not that it is harming the computer.
A decision to disable should meet a higher bar: the symptom must be repeatable, the baseline must show a plausible connection, and the comparison must isolate the compression switch. For example, if the same audio workload produces a measurable CPU spike in the System process while available memory stays high, a short controlled comparison may be reasonable. Even then, keep the change only if the improvement repeats and does not create more paging later.
The amount of installed RAM changes the tradeoff. With 8 GB, compression can postpone page-file pressure and disabling it may reduce the effective capacity of the machine. With 16 GB or 32 GB, there may be more headroom, but the workload, storage speed and driver behavior still matter. More RAM is not a guarantee that an unexplained stutter comes from compression.
If the goal is gaming smoothness, compare the same scene, frame-time capture and background processes. If the goal is a slow application, inspect the application's working set, commit charge and storage latency. If the goal is a lower Task Manager number, do not change a useful system feature just to make a dashboard look cleaner.
- Leave it enabled when the PC is responsive, paging is low and the only concern is seeing a compressed value.
- Test a change only when CPU cost or a compatibility issue is reproducible and measurable.
- Re-enable it when available memory falls faster, disk activity rises or the original symptom returns in another form.
- Do not present a personal before/after result as a guaranteed FPS or latency improvement for every PC.
| Situation | Safer default | What to measure |
|---|---|---|
| 8 GB system with multitasking | Keep compression enabled | Available memory, commit and paging |
| 16–32 GB system with a repeatable CPU complaint | Run one isolated comparison | CPU time, frame time or task latency and disk use |
| Only a large compressed number is visible | Make no change | Whether the number matches a real symptom |
| A driver or application leak is suspected | Investigate the process or driver | Working set growth, events and reproducibility |
The best setting is the one supported by repeatable evidence. A stable default is a valid result.
Troubleshoot high compressed memory without guessing
A high compressed value becomes meaningful when it is paired with pressure or a symptom. Check whether available memory is actually low, whether committed memory is approaching its limit and whether the page file is active. Then look for a process whose working set or commit grows steadily. Compression can be a response to that workload rather than the root cause.
If the issue appears after sleep or a long session, compare a clean restart with the same workload. If it appears only in one game or application, update that software and inspect its own memory behavior. If it appears across every workload, check storage health, page-file configuration, drivers and Windows updates. A memory diagnostic can help when hardware errors are plausible; disabling compression cannot repair faulty RAM.
Use Resource Monitor or RAMMap when Task Manager does not explain the categories. The existing RAMMap download guide points to the official Microsoft Sysinternals package, and the RAMMap troubleshooting guide covers a separate tool failure. RAMMap can show standby priorities, file-backed pages and other physical-memory views, but its numbers still need to be related to the reproducible workload.
Avoid repeated purge scripts and registry edits copied from forums. They can remove useful cache, make the next run slower and hide the original pattern. If the problem is ISLC itself—zero readings, no purge or a missing startup task—use the ISLC troubleshooting guide rather than changing the Windows Memory Manager setting.
- Check available memory and commit before calling the compressed value high.
- Separate a single application's growth from a system-wide driver or storage issue.
- Repeat the workload after a restart and after one change; do not stack several cleaners or timers.
- Keep the original command output and notes so a rollback can be verified.
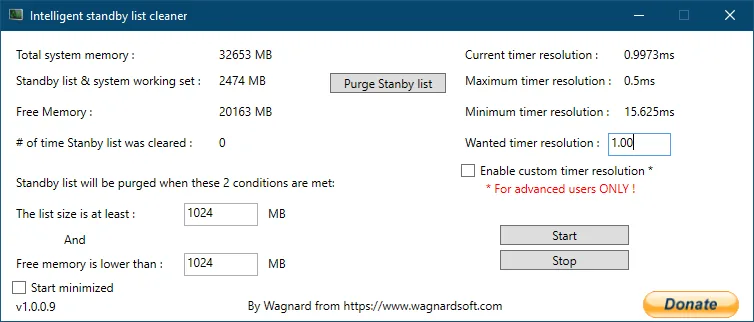
A compressed store can grow because Windows is responding to memory pressure. Find the workload or resource limit before treating the response as the cause.
Where ISLC and RAMMap fit
ISLC and RAMMap can be useful in the same investigation, but they answer different questions from Windows memory compression. ISLC watches standby-list and available-memory thresholds and can request a conditional standby purge. RAMMap exposes physical-memory categories for a manual diagnosis. Neither utility is a switch for the Memory Manager's compression feature.
Read the RAM cleaner comparison before treating a purge as a performance fix. Read the ISLC settings guide when you need threshold definitions, and the ISLC polling-rate guide when you are comparing check frequency. Keep those experiments separate from a compression on/off test so the result remains attributable.
A good sequence is: observe the workload, check compression status, inspect memory categories, then choose one reversible test. If the evidence points to standby pressure, an ISLC threshold experiment may be relevant. If it points to a process leak or a page-file bottleneck, changing compression or purging standby memory is unlikely to solve it.
- Memory compression: an operating-system memory-saving mechanism.
- ISLC: threshold-based standby monitoring and conditional purge.
- RAMMap: detailed physical-memory inspection and manual comparison.
- RAM cleaner claims: a broad label that must be narrowed to a measurable state.
Use one tool for one question. A clean explanation is more valuable than a lower number in a memory dashboard.
Windows Memory Compression FAQ
Is Windows memory compression normal?
Yes. Windows 10 and Windows 11 can compress less-active pages so more data stays in physical RAM. A non-zero Task Manager value is normal when the system remains responsive; investigate the surrounding pressure and symptom rather than the number alone.
How do I check whether memory compression is enabled?
Open Task Manager > Performance > Memory to see the compressed value, then run Get-MMAgent in PowerShell and read MemoryCompression. Save the output before making a change so you can verify a rollback.
How do I disable memory compression in Windows 11?
In an elevated PowerShell window, run Disable-MMAgent -mc, restart if requested, and verify with Get-MMAgent. Treat the command as a controlled diagnostic test. Re-enable it with Enable-MMAgent -mc if paging or responsiveness becomes worse.
Does disabling memory compression improve performance?
Not generally. It can change CPU work on a specific system, but it can also cause earlier paging and more disk activity. Compare the same workload with frame time, latency, available memory and disk use before keeping the change.
Is compressed memory the same as standby memory?
No. Compressed memory is data stored in a smaller form inside RAM. Standby memory is reusable cache. They can both appear in a memory investigation, but they require different checks and should not be cleared or changed by the same assumption.
Should I use ISLC to fix high compressed memory?
ISLC is designed to monitor standby and available-memory thresholds, not to toggle memory compression. Use it only when a repeatable standby-pressure pattern justifies a separate, measured experiment.
Windows memory references
The guide uses the following public references for terminology and current Windows context. Commands and results should still be checked on the reader's own Windows build.
- Microsoft Windows Blog: memory improvements for 8 GB Windows 11 PCs — First-party context on Windows memory efficiency and compression behavior.
- How-To Geek: What Is Memory Compression in Windows 10? — Readable background explanation and Task Manager terminology reference.
- MakeUseOf: Windows memory compression guide — Comparison of status checks and the enable/disable command path.
- Microsoft Sysinternals RAMMap — Official physical-memory diagnostic reference used for the RAMMap boundary.