

Use the official Microsoft Sysinternals RAMMap page or its verified RAMMap.zip link. The page currently lists v1.63 and a 719 KB package label; the direct response checked on August 1, 2026 returned HTTP 200, application/octet-stream and 737,190 bytes. Extract the archive, run the build that matches your Windows architecture, record the current memory map, and use Empty > Empty Standby List only for a controlled comparison. RAMMap is primarily a diagnostic utility, not an automatic RAM cleaner.
Download RAMMap from Microsoft
The direct link below points to the publisher-hosted RAMMap.zip file. If the file link ever changes, use the official Microsoft Sysinternals page in the sources section instead of a third-party mirror.
Download RAMMap.zip (official)Verified August 1, 2026: HTTP 200, application/octet-stream, 737,190 bytes. The ZIP contains RAMMap.exe, RAMMap64.exe, RAMMap64a.exe and Eula.txt.Where to download RAMMap safely
RAMMap is part of Microsoft Sysinternals. Start with the official RAMMap page on Microsoft Learn, which provides the product description, the current version heading and the publisher download link. The page is a better source of truth than a search result that happens to repeat an old filename.
The direct RAMMap.zip download is a publisher-hosted archive rather than a locally re-uploaded executable. The verification performed for this guide received a ZIP response and found the three architecture builds plus Eula.txt. This confirms the file type and package contents; it is not a claim that every system should run the tool or that a hash alone proves safety.
- Prefer Microsoft Sysinternals or Sysinternals Live over unrelated download mirrors.
- Keep the original ZIP until you have recorded the version and extracted files.
- Do not download a file with the right name from a page that cannot identify its publisher.
- Use the official page again if the direct file URL, package size or version changes.
This site links to the publisher file but does not mirror, modify or repackage RAMMap.
What RAMMap shows
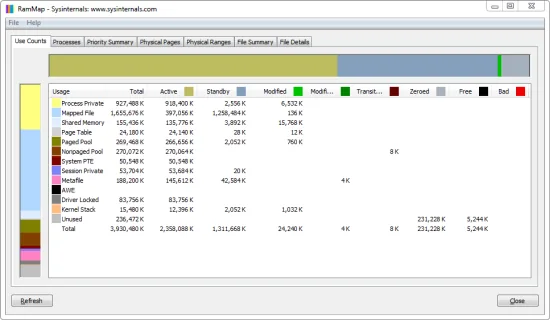
RAMMap answers a different question from a one-click memory cleaner: which physical-memory categories are actually in use? The official utility separates process working sets, standby priorities, file-backed pages, driver-locked pages and other physical ranges that Task Manager summarizes more broadly. That extra detail is useful when a large cached number looks suspicious but does not yet explain a real slowdown.
The tabs are views of the same physical-memory state, not independent cleaning modes. Use Counts gives a summary by type and paging list. Processes connects working-set use to individual processes. Priority Summary shows prioritized standby pages. Physical Pages and Physical Ranges help advanced users inspect page-level placement, while File Summary and File Details connect cached data to files. Start with the summary views and move deeper only when a repeatable symptom justifies it.
- Use Counts: a high-level memory and paging-list summary.
- Processes: working-set sizes associated with individual processes.
- Priority Summary: prioritized standby-list information.
- Physical Pages and Physical Ranges: detailed physical-memory placement.
- File Summary and File Details: file-backed data held in RAM.
A large standby value is not automatically a leak. Compare it with available memory, paging, storage activity and a repeatable workload.
How to use RAMMap on Windows 11
A useful RAMMap test changes one variable at a time. Reproduce the same game area, project, virtual machine or browser workload before clearing anything. Capture Task Manager's Available, Committed and Cached values, then use RAMMap to see whether the standby list or another category is actually involved.
RAMMap can be more informative than a scheduled command because it preserves the inspection step. If you later need repeatable standby-list monitoring, review the ISLC settings guide and keep its thresholds conservative. Do not enable startup automation while the first comparison is still unexplained.
- 1
Download the official archive
Use Microsoft Sysinternals and keep the ZIP as the original source package.
- 2
Extract to a stable folder
Choose a permanent location instead of running from a temporary download directory.
- 3
Run the matching build
Start RAMMap64.exe on a normal 64-bit Windows installation and elevate only when the view or action requires it.
- 4
Record the current state
Review Use Counts and note standby, active, free and other relevant categories before any Empty command.
- 5
Repeat the same workload
Compare the same scenario after one controlled action; do not combine several memory tools in the first test.
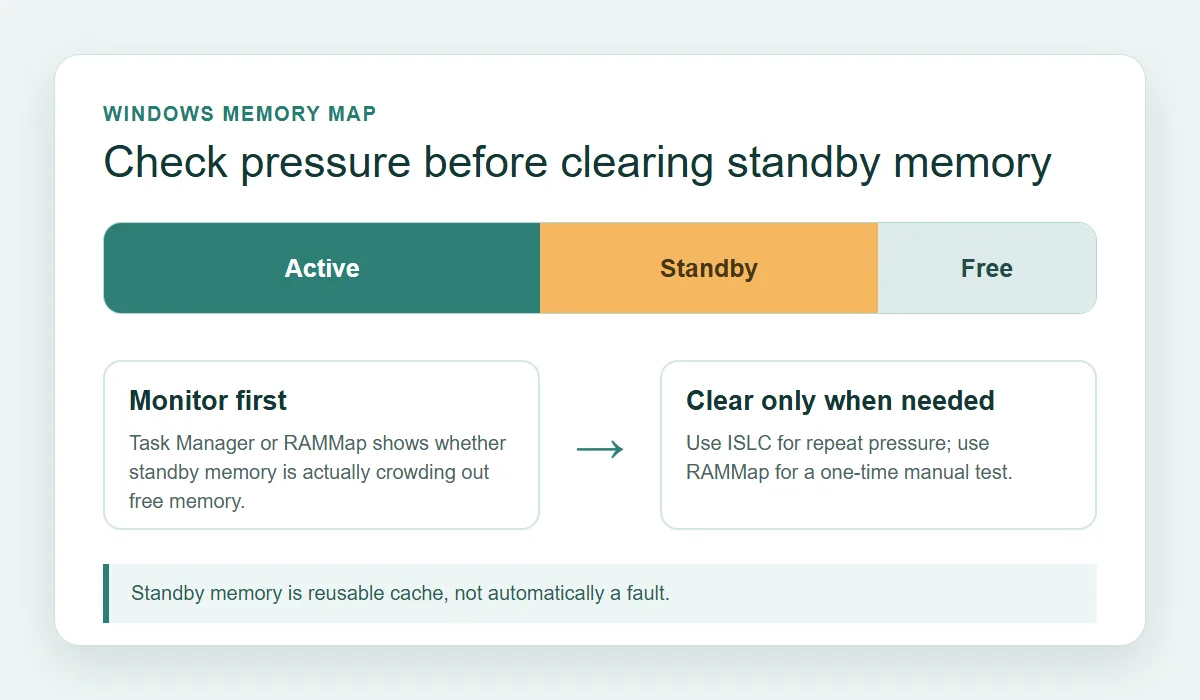
If the problem is a growing process, a driver allocation, storage latency or insufficient physical RAM, emptying standby memory will not fix the cause.
How to empty the standby list with RAMMap
When a controlled comparison specifically points to reclaimable standby pages, open RAMMap's Empty menu and choose only Empty Standby List. Wait for the view to refresh, record what changed and repeat the same workload. Windows may rebuild the standby cache soon afterward because cached files and code are useful; that rebuild is expected and does not mean the action failed.
Avoid clicking every command in the Empty menu. Working sets, modified page lists, priority-zero standby pages and other categories represent different states. Emptying several lists at once removes the ability to tell which action changed the result and can create extra storage reads without improving the original symptom.
- Use Empty Standby List only after recording the pre-test state.
- Do not treat a lower cached number as a performance score.
- Stop if two or three controlled comparisons show no repeatable improvement.
- Do not run a blind scheduled clear together with ISLC.
| Action | Use it for | What to record |
|---|---|---|
| Use Counts | Initial memory diagnosis | Active, standby, free and paging-list values |
| Empty Standby List | One manual comparison | Before/after values and the same workload result |
| Repeat the workload | Checking whether the symptom returns | Load time, hitching, paging or no meaningful change |
RAMMap is a diagnostic utility. A successful empty operation does not prove that standby memory caused the problem.
RAMMap vs ISLC: which one should you use?
Choose RAMMap when you need to inspect physical-memory categories or perform one documented manual comparison. Choose ISLC only when repeated tests show that standby growth and low available memory coincide with a reproducible symptom and you want a threshold-based monitor. The site's Windows 11 RAM cache guide explains the broader decision, while the Empty Standby List guide covers the command-line alternative.
Neither tool is a universal FPS booster. RAMMap exposes evidence; ISLC can request a conditional purge when both configured thresholds are met. If the system is healthy, leave useful cache alone. If the issue persists after a measured test, investigate the workload, driver, storage device, process behavior or installed memory instead of shortening the purge interval.
| Tool | Best use | Automation | Main limitation |
|---|---|---|---|
| RAMMap | Detailed diagnosis and one-time manual test | Manual | Requires interpretation; it does not choose a threshold for you |
| ISLC | Repeatable standby monitoring and conditional purge | Threshold based | Needs conservative settings and a measured reason |
| Task Manager | Quick pressure check | None | Does not expose every physical-memory list |
| Restart Windows | Broad reset after a stuck process or update | Manual | Resets many variables and proves little about standby memory |
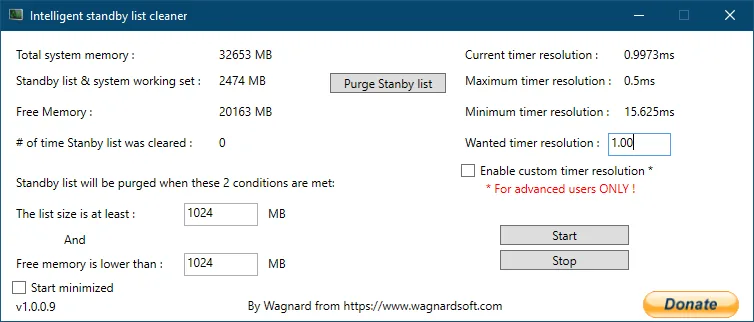
Review the current ISLC build and settings before enabling any background purge.
RAMMap v1.63 version and package checks
The official Microsoft page checked for this guide lists RAMMap v1.63 and a publication date of March 26, 2026. It labels the RAMMap.zip download as 719 KB. The response-level check recorded 737,190 bytes because page labels and HTTP byte counts use different presentation conventions; keep both facts tied to their source rather than converting one into the other.
The downloaded archive's observed SHA-256 was 6536a8107a3fb391e4443f2742366067341a7da50de89f99ca0b2390120dd0cc. Microsoft does not present that value as a publisher checksum on the download page, so treat it as a local file-identity record, not as an independent safety guarantee. If the official version, package or direct URL changes, re-check the source before updating this page.
| Fact | Verified value | How to interpret it |
|---|---|---|
| Current official version | RAMMap v1.63 | Version heading on Microsoft Sysinternals page |
| Published | March 26, 2026 | Date shown on the official page |
| Package label | 719 KB | Publisher's displayed download size |
| Observed response | 737,190 bytes; application/octet-stream | Direct HTTP response checked August 1, 2026 |
| Archive entries | RAMMap.exe, RAMMap64.exe, RAMMap64a.exe, Eula.txt | Contents observed after downloading the ZIP |
Do not call a file safe or official only because its filename and size look familiar. Keep the source URL and check date with the file record.
Limits and mistakes to avoid
RAMMap cannot diagnose every memory problem automatically. A process leak, kernel driver allocation, page-file pressure, storage delay, GPU bottleneck or workload that simply needs more RAM can all look like a vague request to clean memory. Use RAMMap to narrow the question, not to replace a performance baseline.
Avoid downloading repackaged archives, adding RAMMap to startup without a reason, clearing multiple memory lists at once or scheduling a purge every few minutes. If the same workload does not improve after two or three controlled comparisons, accept that result and use the ISLC troubleshooting guide or a more targeted Windows diagnostic path.
- Do not combine RAMMap, EmptyStandbyList.exe and ISLC in the first experiment.
- Do not treat cached memory as waste merely because it is visible.
- Do not use a scheduled clear to hide a steadily growing process.
- Do keep the official source, version, package and test result together.
A measured no-change result is useful evidence. It tells you to investigate a different layer of the system.
RAMMap download and usage FAQ
Where can I download RAMMap?
Use the Microsoft Sysinternals RAMMap page or its publisher-hosted RAMMap.zip link. This site does not mirror or modify the archive.
Is RAMMap free?
RAMMap is distributed as a Microsoft Sysinternals utility. Follow the license and usage information included with the official package.
How do I use RAMMap to clear the standby list?
Record the current memory state, open the Empty menu, choose Empty Standby List once, then repeat the same workload and compare the result. Do not click every Empty command.
Does RAMMap automatically clean RAM?
No. RAMMap is primarily an analysis and manual-action utility. It does not replace a threshold-based monitor such as ISLC and should not be scheduled blindly.
RAMMap or ISLC: which is better?
RAMMap is better for inspection and a one-time test. ISLC is appropriate only when repeated evidence supports conditional standby-list monitoring with conservative thresholds.
Will RAMMap increase FPS?
There is no universal FPS benefit. A one-time standby-list test may help explain a specific symptom, but it cannot fix a GPU, CPU, driver, storage or game-engine bottleneck.
Official RAMMap references
Version, package and usage claims on this page are tied to Microsoft Sysinternals sources checked on August 1, 2026.
- Microsoft Sysinternals RAMMap — Official RAMMap v1.63 page, description, publication date and download link.
- Official RAMMap.zip — Publisher-hosted archive used for the HTTP, MIME, size and ZIP-entry verification.
- Sysinternals Live RAMMap — Microsoft's alternative live-run endpoint listed on the official page.